The stock market, a dynamic and complex entity, is influenced by a multitude of factors. While company-specific news and events undoubtedly play a role, understanding the broader economic landscape is crucial for navigating this ever-changing terrain. Economic indicators serve as the market’s language, offering valuable insights into the health of the economy and providing clues about the potential direction of stock prices. This essay delves into the world of economic indicators, exploring their various types, their impact on the stock market, and how investors can utilize them to make informed investment decisions.
Unveiling the Toolbox: A Categorization of Economic Indicators
Economic indicators can be broadly classified into three categories: leading, lagging, and coincident indicators. Each category provides a unique perspective on the state of the economy, offering a glimpse into the past, present, and future.
- Leading Indicators: These indicators, as the name suggests, act as a crystal ball, offering a glimpse into the future trajectory of the economy. They often focus on aspects like consumer confidence, business investment plans, and manufacturing data. For example, a rise in consumer confidence might signal an increase in future spending, potentially leading to a rise in stock prices.
- Lagging Indicators: These indicators paint a picture of the past economic performance. Metrics like unemployment rate, inflation rate, and GDP growth rate fall under this category. While valuable for understanding current economic conditions, lagging indicators are less effective in predicting future trends.
- Coincident Indicators: These indicators reflect the current state of the economy, providing a real-time snapshot. Examples include retail sales data, industrial production figures, and employment reports. Coincident indicators are crucial for gauging the effectiveness of economic policies and identifying potential turning points in the economic cycle.
Spotlight on Key Indicators: Decoding Their Impact on Stocks
Understanding how specific indicators influence the stock market is crucial for investors. Let’s delve into some of the most impactful economic indicators and their relationship with stock prices:
- Gross Domestic Product (GDP): This metric, representing the total value of goods and services produced in an economy, serves as a barometer of economic health. A rising GDP generally translates to increased corporate profits and consumer spending, potentially leading to a rise in stock prices. Conversely, a declining GDP can signify a recession, leading to decreased corporate earnings and a potential decline in stock prices.
- Consumer Confidence: This indicator gauges consumer sentiment and spending intentions. A rise in consumer confidence suggests increased spending, which can positively impact companies and boost stock prices. Conversely, falling consumer confidence can lead to decreased spending and a potential decline in stock prices.
- Unemployment Rate: A low unemployment rate signifies a strong labor market with increased consumer spending power, potentially leading to higher corporate profits and stock prices. Conversely, a rising unemployment rate suggests a weakening economy and decreased consumer spending, which can impact corporate earnings and put downward pressure on stock prices.
- Inflation Rate: This indicator measures the rate at which the prices of goods and services increase over time. Moderate inflation can be healthy for the economy, but runaway inflation can erode corporate profits and consumer purchasing power, impacting stock prices negatively. Deflation, on the other hand, can be detrimental to economic growth and can also lead to a decline in stock prices.
- Interest Rates: The interest rate set by the Federal Reserve in the US (or central banks in other countries) impacts borrowing costs for businesses and consumers. Lower interest rates can stimulate economic activity by making borrowing more attractive for businesses and consumers, potentially leading to increased corporate profits and stock prices. Conversely, higher interest rates can slow down the economy by making borrowing more expensive, potentially leading to decreased corporate earnings and stock prices.
- Leading Economic Indicators Index: This composite index incorporates various leading indicators, providing a broader view of the economy’s future trajectory. A rising index suggests positive economic growth in the pipeline, potentially leading to higher stock prices. Conversely, a decline in the index can signal a potential economic slowdown, leading to downward pressure on stock prices.
Beyond the Numbers: Considering Interdependencies and Global Context
While individual economic indicators are informative, it’s important to consider their interdependencies. For example, a strong GDP might be accompanied by rising inflation, leading to a potential interest rate hike by the central bank. Investors must analyze the interplay of various indicators to gain a holistic understanding of the economic landscape.
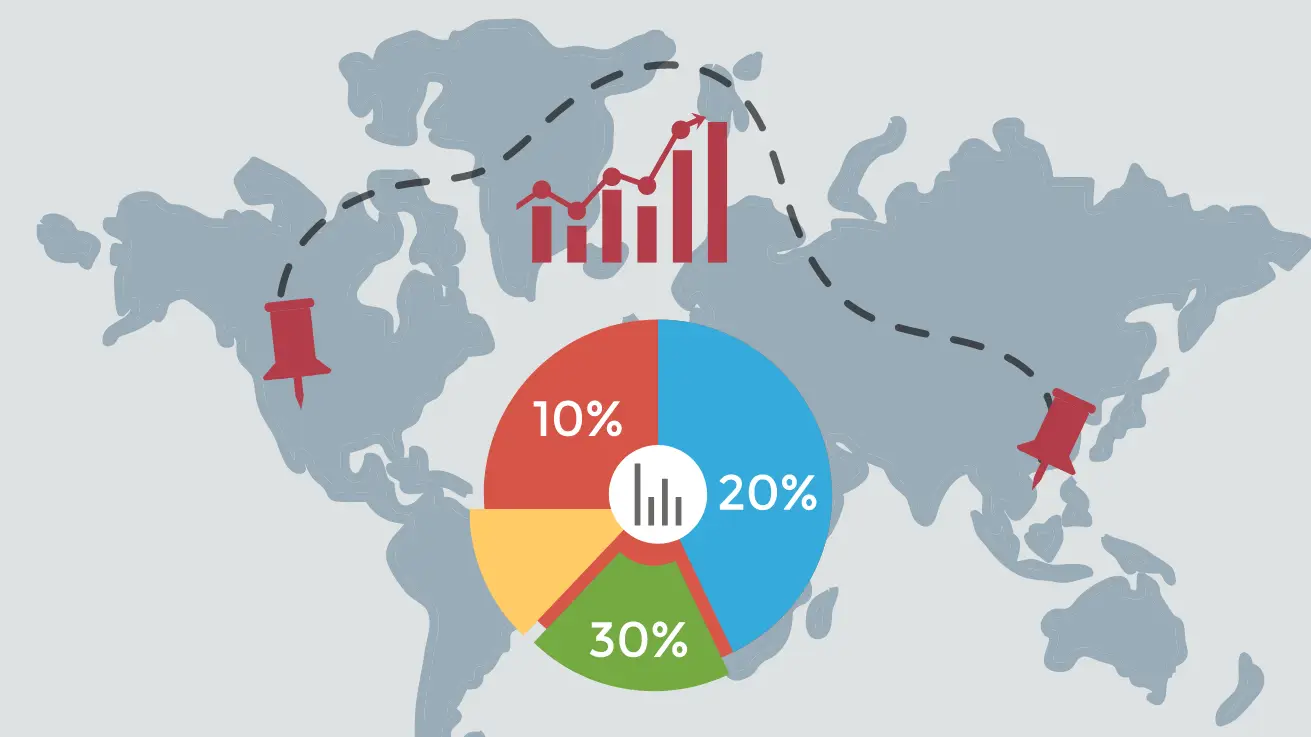
Furthermore, the global economy is interconnected. Events in one region can have a ripple effect on other parts of the world. Investors should stay informed about global economic developments and how they might impact the domestic market they are invested in.
Utilizing Economic Indicators for Informed Investment Decisions
So, how can investors leverage their understanding of economic indicators to make informed decisions? Here are some key strategies:
- Identifying Market Trends: By analyzing leading indicators, investors can anticipate future economic trends and adjust their investment strategies accordingly. For example, a rise in consumer confidence and leading economic indicators might signal an economic boom, suggesting investors might favor stocks in cyclical sectors like consumer discretionary or materials that tend to outperform during such periods. Conversely, a decline in leading indicators might suggest a potential recession, prompting investors to shift towards more defensive sectors like utilities or consumer staples that offer more stability during economic downturns.
- Gauging Risk Tolerance: Economic indicators can help investors assess the overall risk environment. For instance, a rising unemployment rate and inflation might suggest a riskier market environment, prompting investors with a lower risk tolerance to adopt a more conservative investment strategy. Conversely, a strong GDP and low unemployment might indicate a more stable market, potentially allowing investors with a higher risk tolerance to allocate more capital towards growth stocks.
- Understanding Company Performance: While economic indicators provide valuable insights, they should not be the sole factor driving investment decisions. Investors should always conduct thorough company-specific research, analyzing factors like financial statements, competitive landscape, and future growth prospects. Economic indicators can help contextualize a company’s performance within the broader economic environment.
- Avoiding Overreaction: The market can be volatile, and economic indicators can sometimes send mixed signals. Investors should avoid overreacting to short-term fluctuations in economic data. It’s crucial to maintain a long-term perspective and base investment decisions on a comprehensive analysis of both economic trends and company fundamentals.
Beyond the Basics: Advanced Strategies for Seasoned Investors
For seasoned investors seeking to refine their economic indicator analysis, several advanced strategies can be employed:
- Market Timing: While notoriously difficult, some investors attempt to time the market by using economic indicators to predict turning points in the economic cycle. This strategy requires a deep understanding of economic data and advanced technical analysis skills.
- Sector Rotation: Seasoned investors may use economic indicators to strategically rotate their portfolios between sectors that outperform during different economic phases. For example, they might invest more heavily in financials during an economic recovery but shift towards healthcare during a recession.
- Economic Sentiment Analysis: Advanced investors may delve into economic sentiment surveys and business confidence indicators to gauge the collective outlook of businesses and consumers. This can provide valuable insights into potential future economic activity and its impact on stock prices.
Navigating the Uncertain: Limitations of Economic Indicators
Economic indicators, while valuable, have limitations. They are not perfect predictors of the future, and unforeseen events like natural disasters, political upheavals, or technological breakthroughs can significantly impact the economy and stock market. Additionally, economic data can be revised, and there is always a lag between when data is collected and released, potentially hindering its real-time effectiveness.
Conclusion: The Symphony of Economic Indicators and Stock Market Performance
Understanding economic indicators is a powerful tool for stock market investors. By analyzing leading, lagging, and coincident indicators, investors can gain valuable insights into the health of the economy, anticipate potential market trends, and make informed investment decisions. However, it’s crucial to remember that economic indicators are just one piece of the puzzle. Investors must combine this knowledge with thorough company research and a long-term investment strategy to navigate the ever-evolving market landscape. As with any symphony, economic indicators work best when played in harmony with other financial instruments, leading to a more informed and successful investment experience.